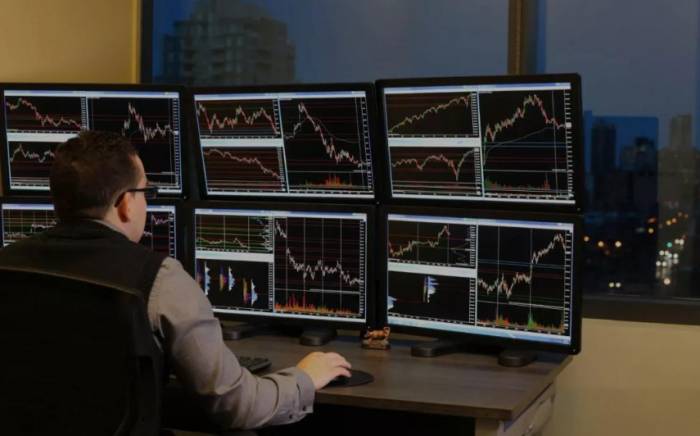
I've noticed that many traders have a penchant for keeping a close eye on the market, often clutching their phones or computers, watching the flickering candlestick charts for any trading opportunities.
The market trend has a certain magic to it; you might have a very clear trading plan, but because you're watching the market too closely, you get carried away. You end up trading in instruments you shouldn't, entering the market at the wrong times, and making premature profit-taking or stop-loss decisions.
Do those who truly excel in trading need to watch the market every day? Well, I don't.
Whether or not you need to frequently monitor the market depends on your trading strategy. If you are inherently a short-term or ultra-short-term trader, it's understandable to keep a daily watch on the market. However, if you are a medium to long-term trader, frequent monitoring can be self-inflicted torture.
Sometimes, the inability to profit is not due to a lack of trading skills, but rather a failure to control the extent of your market watching.
In today's article, I will discuss this topic in three parts: first, the common bad habits people have when monitoring the market; second, the techniques of market watching; and finally, the specific operations for short, medium, and long-term market watching.
1. What are the common bad habits people have when monitoring the market?
1) People often over-monitor the market.
Many individuals can't help but take out their phones during the trading process to check the market fluctuations, calculating how much the current price has changed since the last time they checked. If the market rises, they want to go long; if it falls, they want to go short, fearing to miss out on opportunities and profits.
As a result, they inexplicably disrupt their original trading plan and open a position. When an opportunity that aligns with their trading plan arrives, they miss it, and all that's left is to slap their thighs in regret.Some people even find it exhilarating to watch the market closely, as they can see the real-time changes in the market trends, observe their gains and losses, and feel happier when they make a profit, and disheartened when they suffer a loss. Each time they open their trading software, it's like opening a lottery ticket, filled with excitement and anticipation.
When you are frequently swayed by such emotions, your focus is no longer on the strategy itself but on the immediate market fluctuations. To cater to your emotions and to make yourself a little happier, you may hold onto positions that you should let go, or be reluctant to cut losses when you should, ultimately leading to more losses than gains and an inability to make a profit.
2) Starting to slack off in monitoring the market.
After monitoring the market for a long time and continuously incurring losses, trading becomes increasingly poor, and the heart becomes very tired, resulting in a tendency to start slacking off and relaxing the monitoring of the market.
Sometimes when the market does not reach the target position, boredom sets in and leads to distractions such as browsing short videos or playing games, which can result in missing opportunities due to being too engrossed.
During my phases of trading losses, I often encounter this kind of mystical situation. Whenever I monitor the market closely, it doesn't move, but as soon as I get busy with something else, the market moves significantly, which can be really infuriating at times.
These are the common pitfalls we often fall into when monitoring the market. So, what should we do to adjust our monitoring frequency? And what is the right monitoring frequency? I will continue to discuss this next.
2. How to adjust your market monitoring habits?
Achieving scientific market monitoring is actually quite simple, and I will share my own three experiences, which have all been very effective.
First, make a trading plan and ensure it is not too complicated.Many people stare at the trading charts aimlessly because they lack a trading plan. With a candlestick chart in front of you, you have no goal, no idea whether to go long or short in the current market, and you don't know where to enter or exit.
If you don't even have a goal, what are you staring at? Therefore, many people feel that the market is full of opportunities, and missing out on one seems like losing a fortune. As a result, they trade frequently, incur losses, trade again, and fall into a vicious cycle.
Let me use a picture to briefly explain how to watch the market with a trading plan. The chart shows the 1-hour candlestick chart of ferrosilicon 2307.
If the trading plan is to reverse at the pressure level, the trader needs to keep a close eye on the important resistance level of 7664 above.
If it's to enter on a pullback, the trader should focus on the 50% Fibonacci support level of 7454.
So, the so-called watching the market is to focus on the key points in the trading plan, not to stare aimlessly, and to do everything according to the trading plan.
In addition, the trading plan must be set up to be simple, so you don't have to watch the market frequently during the operation.
For example, after a trading system order is entered, set the stop loss and take profit, and there is no operation of adding or reducing positions. Basically, you can stop watching this order, let the market run, either stop loss or take profit, and wait for the result.
If there are operations of adding or reducing positions in the trading system, you need to pay attention to the changes of this order during the holding process and carry out the operations of adding or reducing positions. This increases the number of times you watch the market, and you are inevitably affected by the market fluctuations and changes in profit and loss, leading to psychological issues.Therefore, I prefer a trading system without any adjustments to positions, which is cleaner and simpler, reducing my frequent interactions with the market and also minimizing emotional fluctuations.
The four principles of monitoring the market are:
(1) Do not monitor instruments that are not part of your trading.
(2) Do not monitor timeframes that are not part of your trading.
(3) Do not monitor positions that are not included in your trading plan.
(4) Do not monitor times that are not part of your trading schedule.
Secondly, one can utilize the alert and order placement features on trading software to improve the efficiency of market monitoring.
Most trading software includes a price alert feature that triggers an alarm on the computer when the market reaches the price we are monitoring.
Additionally, the order placement feature on trading software can be used. For example, if the trading plan is to open a short position directly at the price of 7664, one can place a sell order at this price.
It is also advisable to set an alert at this price so that when the order is executed, you can receive a notification to take a look and it also facilitates the next steps in your trading operations.When the alarm doesn't go off, you can do other things, such as drinking tea, reading books, and taking care of children. After maintaining a certain distance from the market, you will feel much more comfortable.
Secondly, understanding your own schedule is more beneficial for monitoring the market.
When I first started trading, I was a "diligent" trader, monitoring the market for at least ten hours a day, from morning to late at night, for fear of missing any opportunity to make money.
At that time, I truly experienced the feeling of love, being able to pick it up but not able to put it down. I almost spent every day with a computer, sleeping only 4-5 hours a day, with no other life at all.
After a month, I started to lose my hair, and I became listless and emotionally unstable. It would be strange to make a profit in this state.
Therefore, our market monitoring time must fit our own schedule. For example, if you are only free in the evening, you should make a trading plan for the night market. If you can only take a brief glance at the market situation every day, then you should focus on a larger cycle.
In the following section, I will specifically explain how to monitor the market for short, medium, and long-term trading.
3. How should we monitor the market in practical short, medium, and long-term trading?
Firstly, short-term trading.
The time cycle for short-term trading is generally 5 minutes, 15 minutes of K-line, with small profit and stop-loss spaces, which can generally be closed on the same day.Let me give you a brief demonstration of the method for short-term trading and monitoring the market. See the image below.
The image shows a 5-minute candlestick chart of the Euro to US Dollar exchange rate.
After a wide range of fluctuations the previous day, the market entered a converging consolidation, forming a narrow rectangle consolidation pattern at the 5-minute level.
We formulate a trading plan to enter the market when the price breaks through the rectangle consolidation, going long on an upward break and short on a downward break.
Therefore, in this segment of the market, we need to focus on the resistance level above and the support level below. We can place break-even orders directly above and below (as shown on the left side of the image, place break-even buy and sell orders respectively).
Alarms can be set at these two order positions, and if the alarm does not sound, we don't need to look at it; we can just go about our business.
Let's take a look at the subsequent trend.
In the image, the market breaks downward, and the break-even order below is executed. After the execution, delete the break-even order above and set a stop loss above the rectangle consolidation.
Set a profit-taking position below, and also recommend that everyone set alarms at the stop loss and profit-taking positions. After setting the alarms, do not pay attention to this order anymore. Do not look at it if the alarm does not sound, to avoid market fluctuations affecting our mentality and execution.
Secondly, medium-term (swing) trading.Medium-term (swing) trading typically employs 1-hour chart candlestick patterns or 4-hour chart candlestick patterns, with positions held for several days, or even up to a week. This is the type of trading I engage in.
The chart shows a 1-hour candlestick chart of the Euro to US Dollar exchange rate.
After a 5-day period of consolidation, the market formed a structure that broke upwards from the bottom following a fake breakout to the downside.
At this point, we formulate a trading plan, waiting for the market to retrace to support and form a reversal candlestick pattern before entering a long position.
We should focus on the horizontal support below and the reverse support after the trend line breaks; these are two key areas of support.
We can set up alerts near this support zone, waiting for the market to pull back.
Let's take a look at the subsequent trend.
After the breakout, the market underwent a 20-hour period of consolidation, testing the support of the trend line, and then quickly formed a large bullish reversal candlestick. After the close, we opened a long position with a stop loss set at the low point below, and also set a profit target.
Since our entry rule is based on the reversal candlestick pattern on the hourly chart, we can monitor the market once every hour during the waiting period to observe whether the candlestick pattern has formed a reversal. There is no need to watch the market at other times.
Thirdly, long-term trading.Long-term trading involves using daily charts or even larger time frame candlestick charts for trading, with holding periods that can span several weeks or even longer.
Long-term trading is the trading mode with the lowest frequency of monitoring the market, and the targets for stop-loss and take-profit in long-term trading are quite large, so there is no need for extremely precise entry points.
The chart shows the daily candlestick chart of the Euro to US Dollar, and the market trend is also in the form of a broken trendline.
After several months of decline, a strong downward trendline break occurred, and the trend shifted from bearish to bullish. We formulated a trading plan to enter long positions on the first wave of the uptrend at the 50% and 68% retracement levels, placing orders directly at these two positions.
Since the order prices are far from the current price, it is sufficient to check the market changes once a day after placing the orders.
Let's look at the subsequent trend.
After 10 trading days of high-level consolidation and a deep pullback, the first order is executed.
Following the execution of the first order, after another 4 trading days of low-level consolidation, the second order is executed.
After both orders are executed, the stop-loss is moved up, and the take-profit is set accordingly.
Throughout the process of order execution, it is sufficient to monitor the market once a day. After setting the stop-loss and take-profit, the market can be allowed to develop freely, and the frequency of monitoring can be even lower.The short-term, medium-term, and long-term monitoring details discussed above may vary slightly depending on the different trading standards used by everyone, but the overall frequency and rhythm of monitoring are similar.
Many people fail to pay attention to the monitoring process and are carried away by the rhythm of the market, which is why they cannot achieve profits.
Therefore, in trading, we must pay attention to every detail. Only by addressing every detail can we stand out from the crowd of traders and make money.


